

Intro
I, like tens of millions around the globe, have played the EA FIFA game series for more than two decades. But beyond its entertainment capabilities, it possesses a vast dataset of full player ratings, market value and metadata spanning over a decade, granting a great opportunity to learn about the development of football players over time.
The FIFA project is my 2nd series that meets data science with the world's most beloved sport. This mini-series will focus on what football insights we can squeeze out of the EA FIFA dataset alone.
Starting from the basics, and gradually tackling more complex (and useful) tasks that require heavier mathematical tools. Ultimately, the voyage ends
-
Chapter 1: What Comes and Goes with Age
-
Chapter 2: Player Valuation
-
Chapter 3: Predicting the Future
#1 What Comes and Goes with Age
Delving into the intricate relationship between age and football performance, covering the questions:
How on- and off-ball skills, evolve with age
Why attackers and defenders affected differently
Golden age or a tipping point? Why the ages of 23-24 are crucial in players careers?
Examining nations and league based trends
Introducing Career phases - a robust clustering-based approach to explore and understand players development

Footballers Evolution


Career phases
Analyzing the curves over time allowed us more long-period observations of players’ careers. However, we, the fans, often feel more comfortable using ordinal phases to describe player states, such as growth, decline, or peak performance. For our needs, we will define five distinct career phases:

Acc-decay
Decrease of ≥ 4 points in overall rating YoY

Mid-decay
Decrease of 1-3 points in overall rating YoY

Stagnation
Between -1 to +1 points change in overall rating YoY

Mid-growth
Increase of 2-3 points in overall rating YoY

Acc-growth
Increase of ≥ 4 points in overall rating YoY
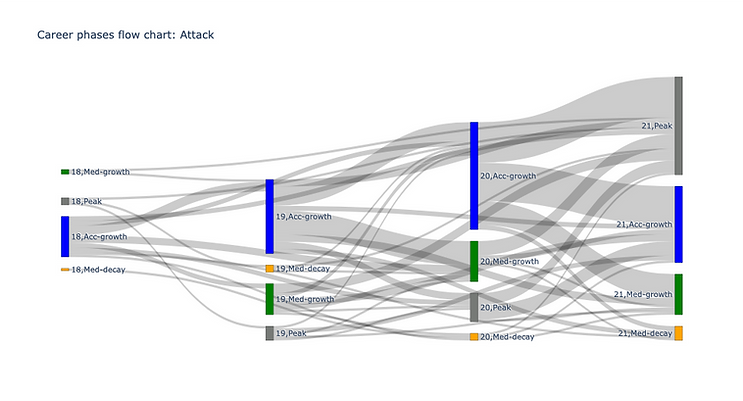
The career phases graph for attackers between the ages of 18–21. Each node is permutation of (age, career phase). The height of a node’s rectangle reflects its sample size, color by career phase.
The Tale of D. Alli and O. Watkins


2018
2019
2020
2021
2022
2023
2017
2024


On their 20th birthdays, Alli and Watkins were about 20 rating points apart, in favor of Alli, one of the most promising English football players that year. This gap remained high as Alli continue to shine in Tottenham Hotspur. Nevertheless, by the age of 22, Alli reached stagnation, i.e., the peak. Over time, Watkins’ consistent improvement was catching him up, while Alli struggled to meet the challenge of his own high bar, resulting in dropping potential. Today, Alli still leads overall. However, judging on potential, Watkins is now rated higher than Alli for the first time ever. Any gambles on next year’s ratings?

#2 Player Valuation
Shifting our focus to the economics of football!
We take a data-driven approach to understanding the forces behind these value shifts, exploring the key drivers that shape this multi-billion dollar industry, including:
Player age
Macro trends and market inflation
Global sporting events
Club, league, and nationality trends
The impact of individual skills on market value

Leagues, Clubs and Nations

Average nationalities’ price over time, with global avg baseline (left);

Average leagues’ price over time, with global average baseline (right).

Players’ average value by year (right) for selected clubs
Average nationalities’ price over time, with global avg baseline (left);
Formulating FIFA market value
FIFA market value modeling with Linear Regression
Finding under/over-valued players
Analyzing biggest under/over-estimates

Model prediction vs. true FIFA player value: for players valued over 5M Euros
#3 Predicting the Future
Forecasting Next Season’s FIFA Player Ratings with Machine Learning
Can we identify the next breakout stars before the rest of the world does?
The goal: predict whether a player’s FIFA rating will improve in the next edition of the game.
Experimenting with a range of machine learning and deep learning models, leveraging hundreds of features—including similarity-based metrics, time-series signals, historical aggregates, and more.

System Architecture

A schematic view of the full data-to-modeling pipeline. Raw data is enriched with both tabular and time-based features, then filtered and passed into the final classifier.
Proving Success
Evaluating three potential scouting strategies:
Safe Bets: Among the model’s most confident predictions — whether for growth or decline
Big-movers: Can the model detect players on the verge of a breakout, or a breakdown?
Spotlight Players: Young talents and rising stars

Model Performance on EA Future Stars 2024 players. Marker size reflects FIFA rating. Green = correct prediction; red = error.

Model Performance on spotlight players. Marker size reflects FIFA rating. Green = correct prediction; red = error.

Precision and recall across Top/Bottom N predictions ranked by confidence.
Model Performance on EA Future Stars 2024 players. Marker size reflects FIFA rating. Green = correct prediction; red = error.